Here are the links to both versions:
iPadOS
MacOS
By the end of this tutorial you should know how to create an audio module from low level DSP components with a GUI and add it to your toolbox for future use.
Because VisualSwift is very new, I'll assume that this tutorial will be mostly for beginners so I'll explain some feature of the IDE in detail.
1-What is a Smooth module?
The smooth module follows an audio signal but responds slowly to quick changes. It is very useful for example to smoothen user input when a button is tapped and changes a value immediately or a knob is rotated fast.
If you understand the Faust audio programming language, it is defined as:
Code: Select all
smooth(s) = *(1.0 - s) : + ~ *(s);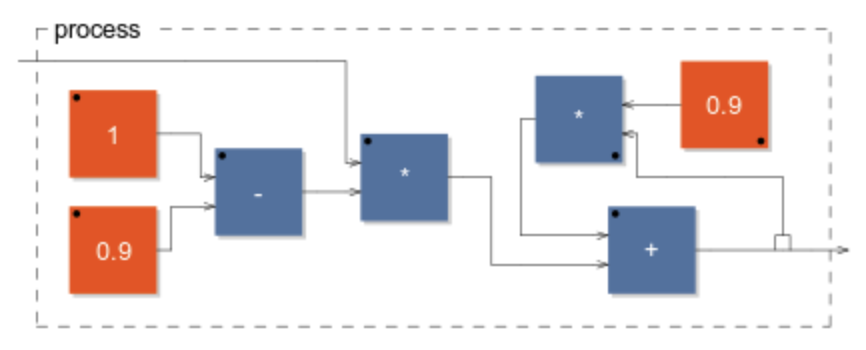
So now our task is to recreate the diagram above using VisualSwift's low level DSP components but first you need to know how to visualise audio signals.
2-Visualising Audio signals with VisualSwift
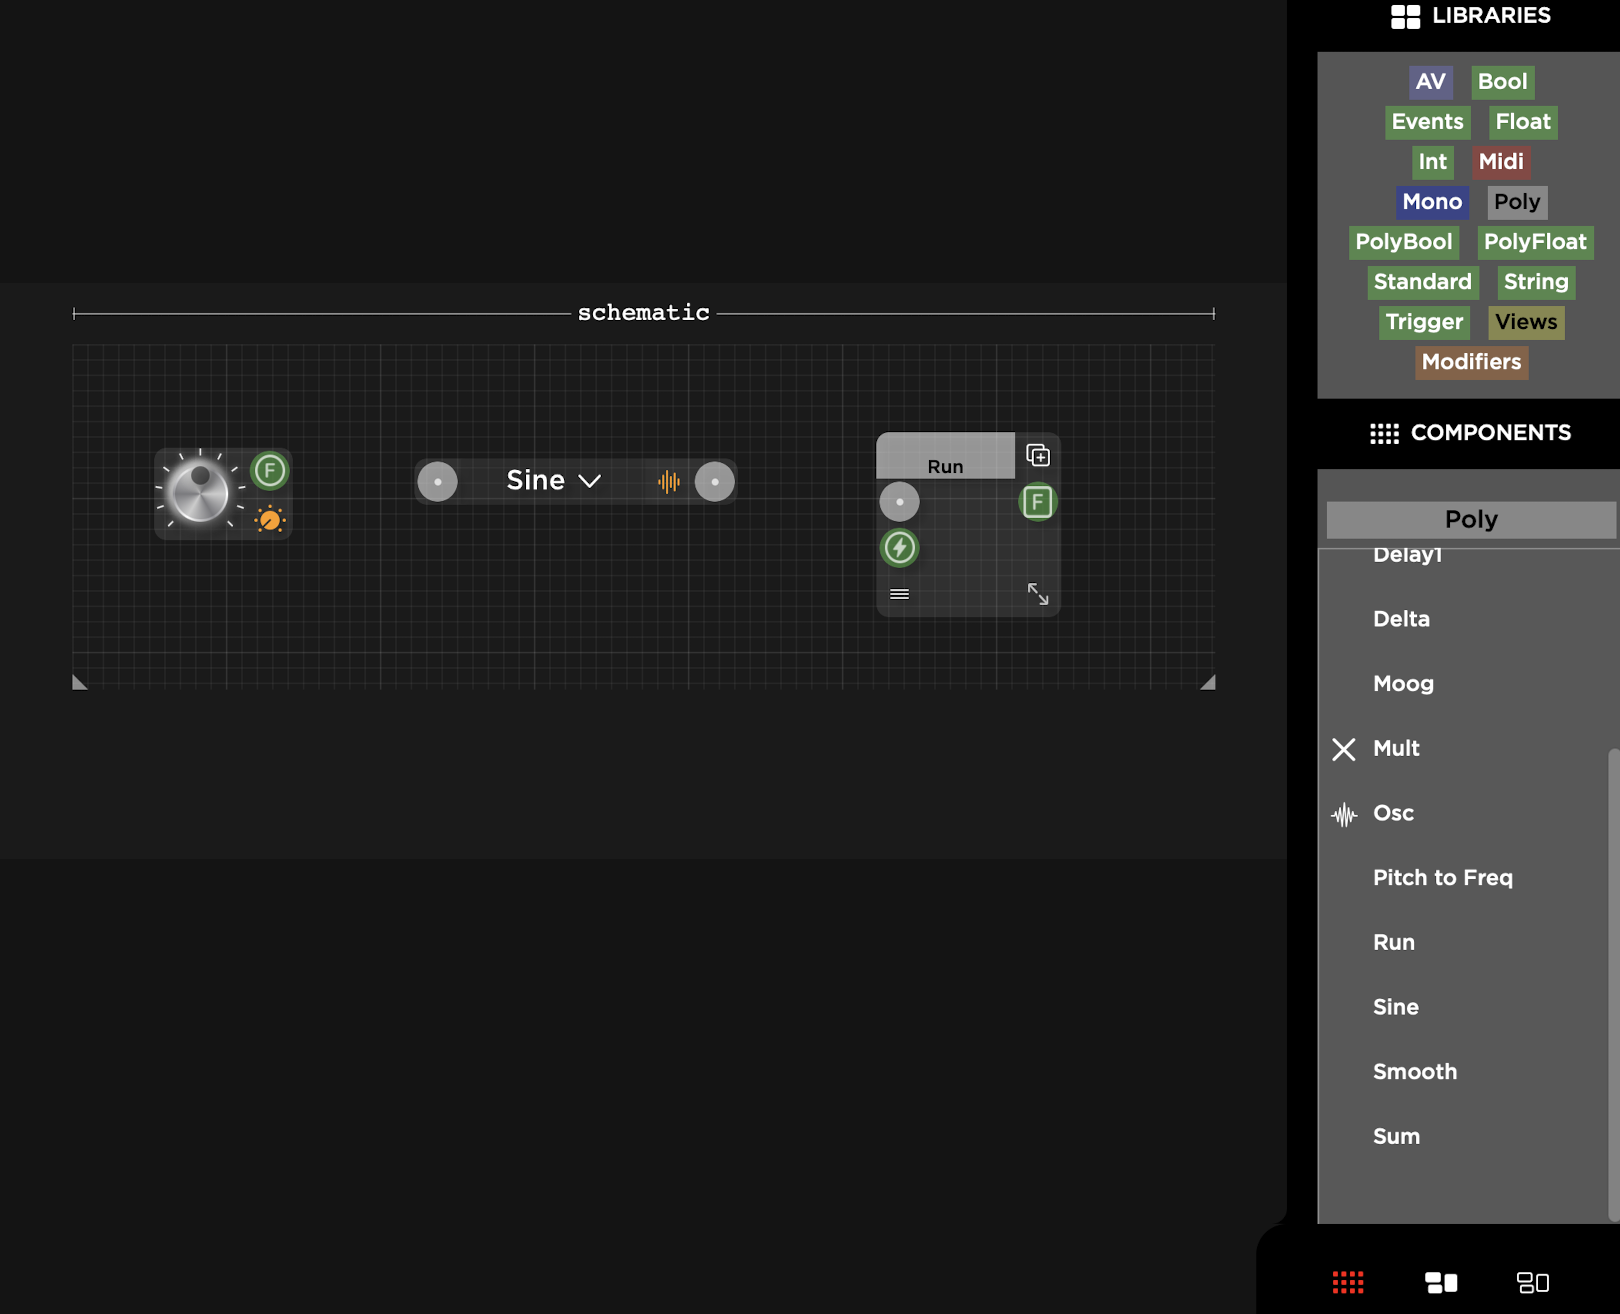
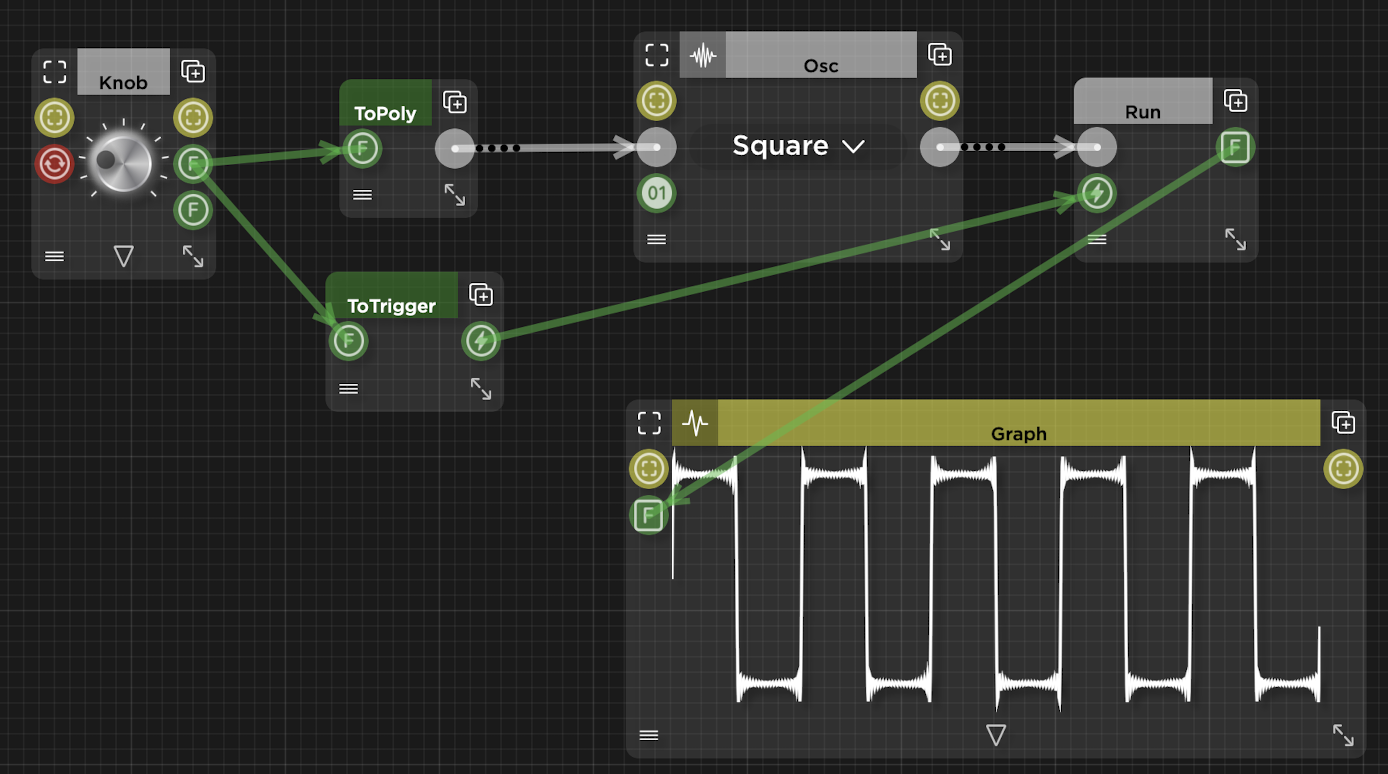
Let's start with the simple task of visualising a square wave, we need to drag into the schematic 3 components: FloatKnob, PolyOsc and PolyRun:
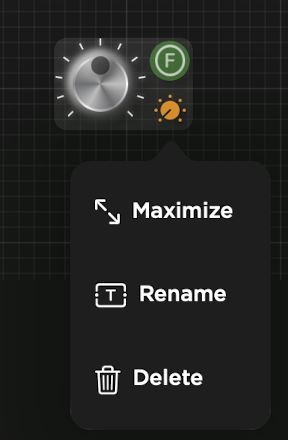
Some components have a minimised state, in the case above the Knob and Osc components are minimised, click the orange icon to show a menu with the option to maximise them:
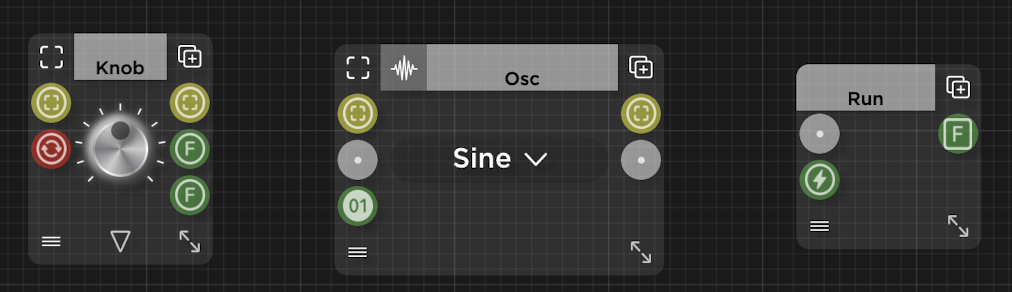
With the components maximised they should look as follows:
The Knob will be used to control the frequency of the Oscillator which will be set to a Square wave, the Run component will compile the schematic and when triggered run the compiled code and output the computed waveform which we'll connect to a Graph component. The reason for choosing a square wave is because later on we'll be testing the Smooth module to see if it rounds the corners of the wave.
For now please ignore the yellow connectors, we'll come back to them when creating the GUI for the Smooth module. Also ignore the red connector which is used for controlling the knob with an external Midi controller and will not be used in this tutorial.
First lets convert the float value coming out of the Knob into a Poly type, an easy way to do that is to drag from the output into an empty part of the schematic, a popup context menu should appear as follows:
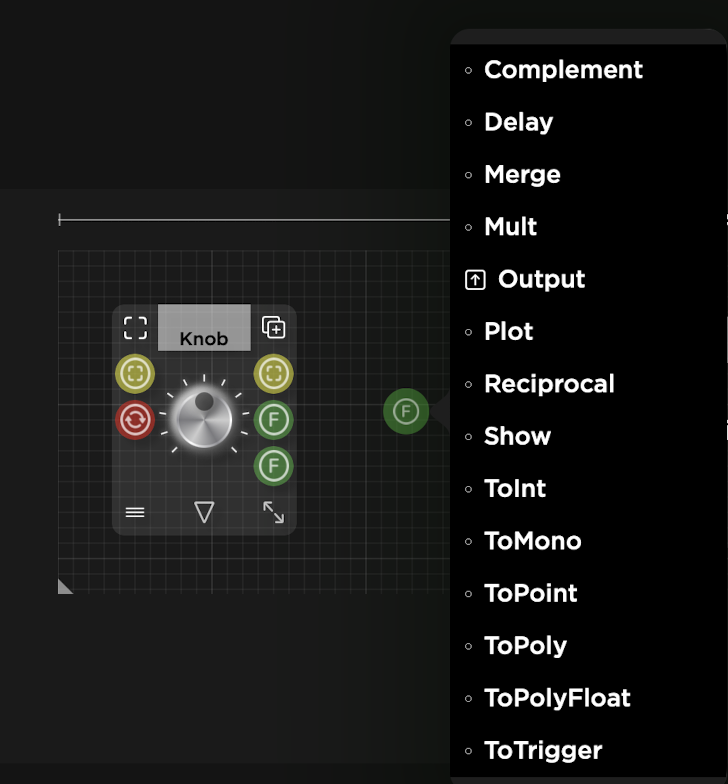
Now select "ToPoly" and you should end up with the following:
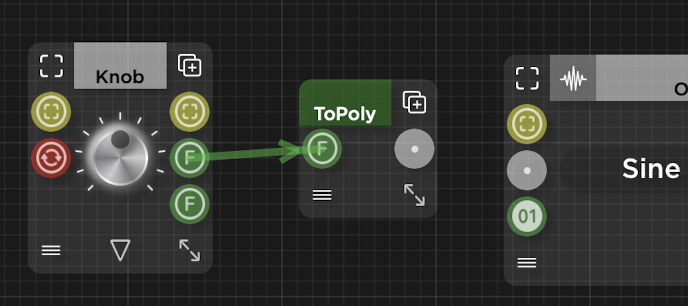
The green Float connectors correspond to discreet timed events while the light gray poly connectors correspond to multiple audio streams running in real time at sample rate.
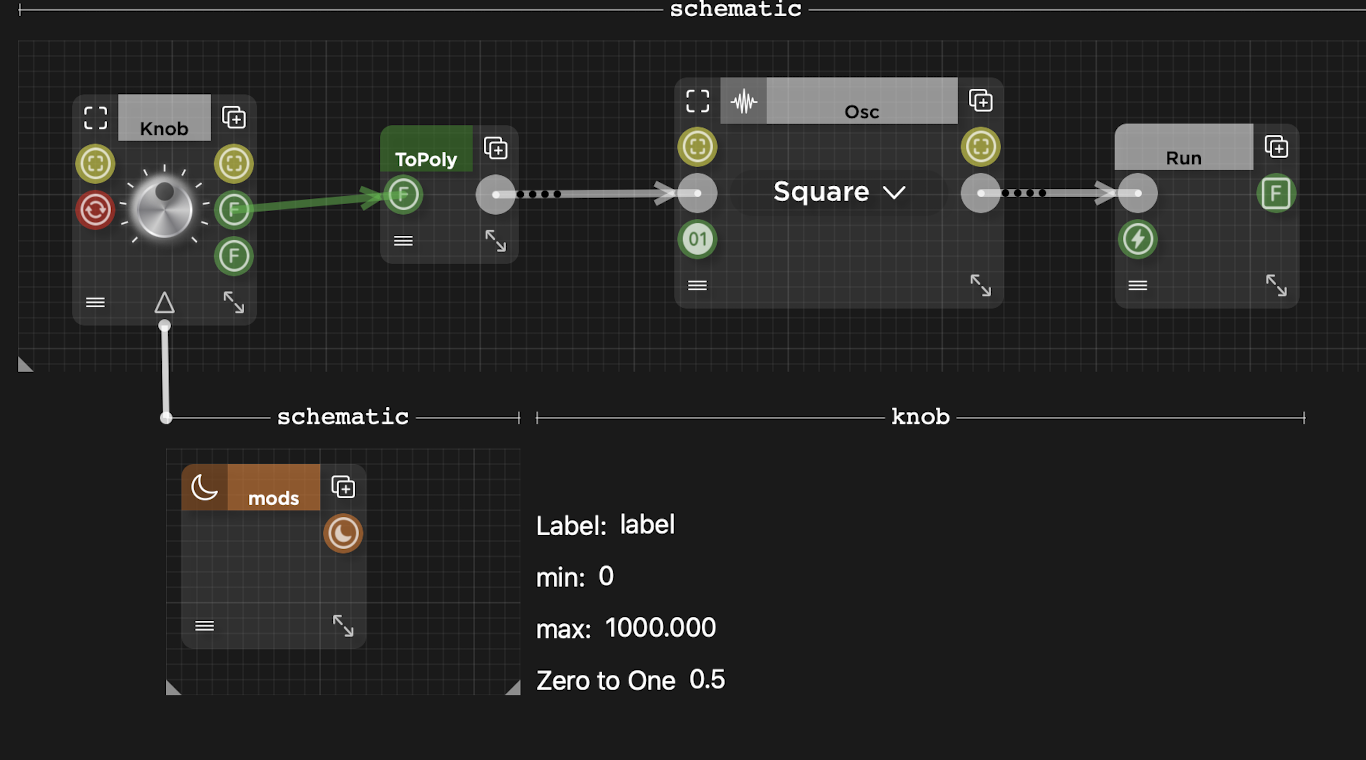
The Knob by default outputs values between 0.0 and 1.0, we need to change the maximum to a value that makes more sense as a frequency, click on the little triangle at the bottom of the Knob and change the max to 1000.0, also change the waveform to Square and connect the oscillator to the Run component:
Now we need the Run component to be triggered every time we update the frequency so convert the Knob's Float output to Trigger and connect it to the Run component:
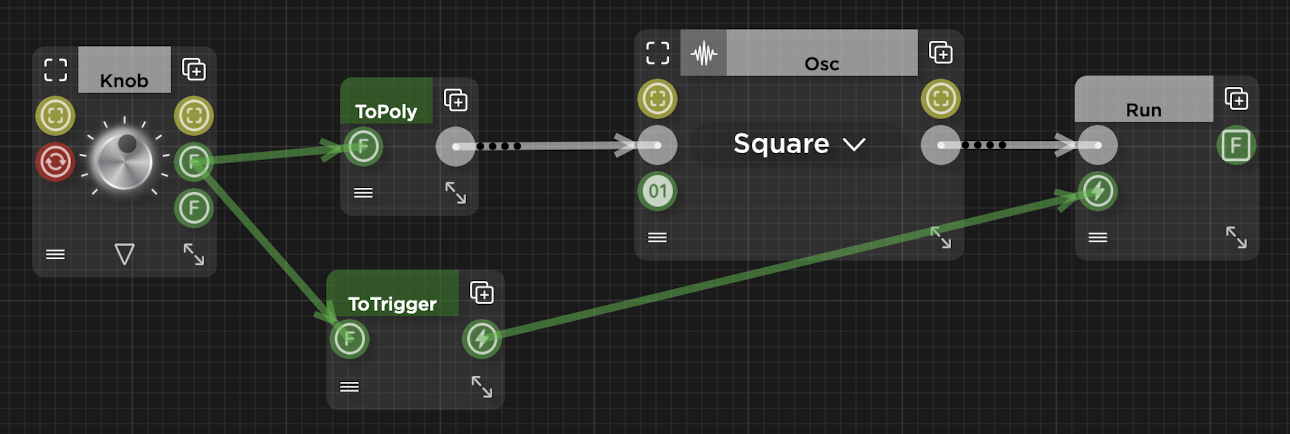
The Trigger event has a time stamp like the Float event but has no payload, as the name implies it is used to trigger actions, in this case it triggers the Run component to run the compiled code.
After connecting the FloatArray output from the Run component into a Graph component we can finally visualise the Square waveform changing as we rotate the frequency Knob:
We can do a bit of tidying up by bending the links, it's quite easy and you can probably figure it out without any instructions:
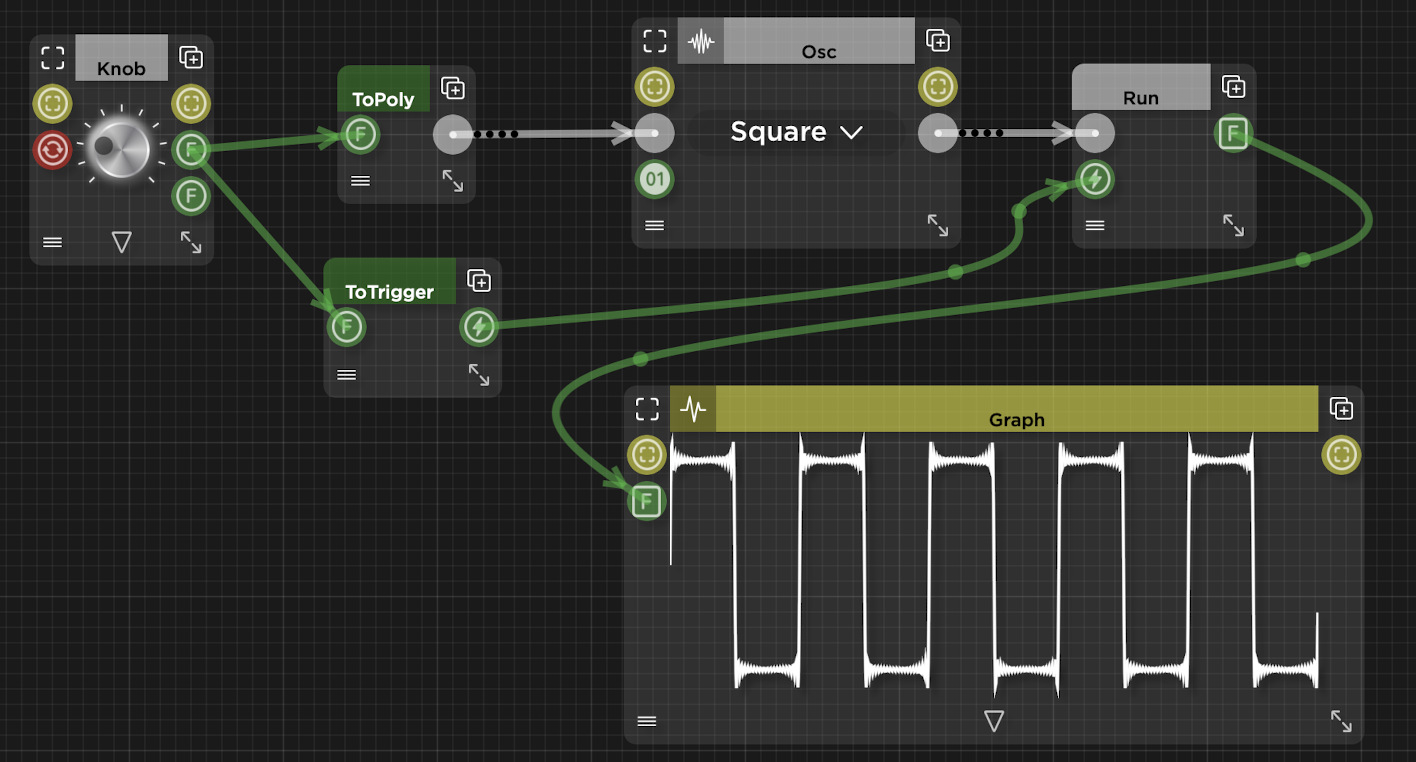
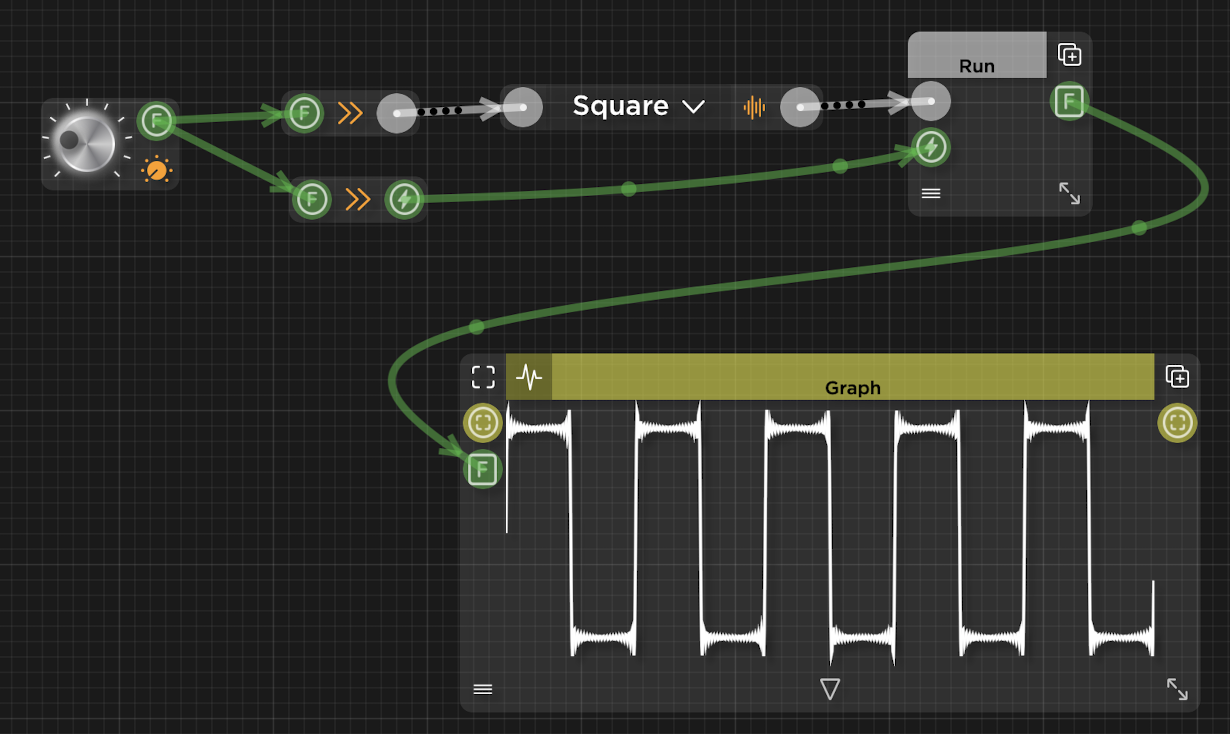
We can also minimise some of the components which is quite useful with complex schematics as it makes them easier to understand:
As this post is getting long I'll split it into parts, the continuation will be in Part 2.